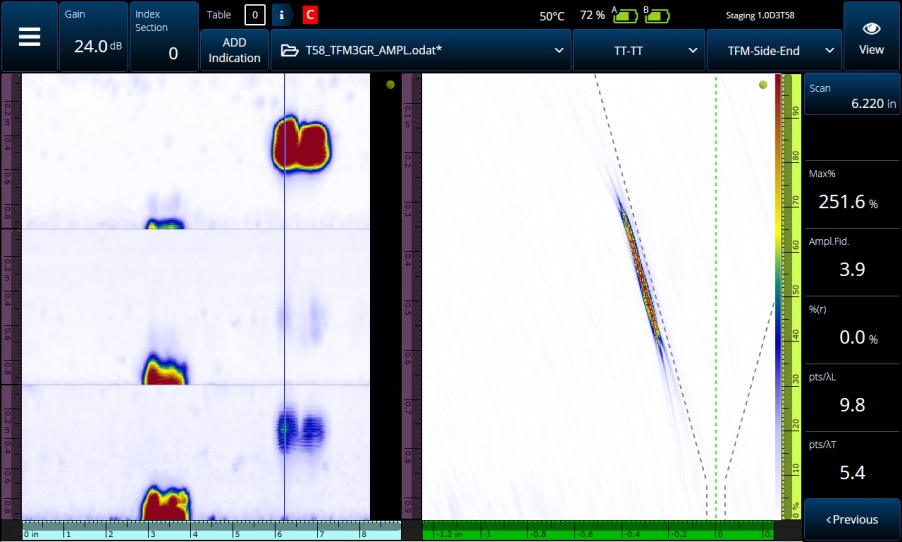
The OmniScan® X3 phased array ultrasonic (PAUT) flaw detector comes with advanced data acquisition and processing capabilities known as full matrix capture/total focusing method (FMC/TFM). This technique optimizes the probe’s signals for improved images and more reliable results in certain applications.
We didn’t just add FMC/TFM to an OmniScan flaw detector—we also made it better. In this blog post, we discuss the top 3 ways we improved FMC/TFM. But first, let’s discuss the basics.
What is FMC?
Full matrix capture (FMC) is a data acquisition strategy that acquires every possible transmit and receive combination for an array of transducers—in other words, the complete acoustic information provided by all the elements of the phased array probe. Each element fires individually, while all the other elements of the array receive, or “listen” to, the returned signals. This generates a matrix of elementary A-scans, which composes the FMC data set. Unlike phased array acquisition, with the FMC method there is no time delay, or beam steering, performed using programmed focal laws.
What is TFM?
Total focusing method (TFM) processing makes sense of the data acquired by the FMC. The TFM algorithms use specific variables to sort the extensive elementary A-scan data contained in the FMC data set into wave sets. These wave sets—or propagation modes—represent a path of ultrasound waves from the transmitter to an image pixel position and back to the receiver (including reflections), defined by the types of waves for each leg of that path, either transverse (T) or longitudinal (L).
In the OmniScan X3 flaw detector, as the PA probe scans the part, the FMC data is recorded and encoded while the TFM processes it. Resulting TFM images are displayed live for all the selected wave sets (up to four wave sets at a time). The same FMC data set is reprocessed multiple times to generate different reconstruction parameters for a given encoder position.
Identifying a Flaw’s Orientation is Easier, Even for the Untrained Eye
Under certain conditions, the TFM views provide highly focused images of flaws in their true geometrical position in the part. Rendition depends on a few factors, including the choice of probe and wedge, the scan method, prior knowledge of the part characteristics, and the selected propagation mode (or wave set) used. If you need to report to colleagues who are unfamiliar with this technology, helping them decipher the geometrical orientation of flaws is easier.
Is TFM Better Than Phased Array?
The total focusing method versus phased array debate is not cut and dry. The FMC/TFM technique offers many advantages for some applications, whereas phased array may be more advantageous for others. Having a high-performance instrument with high-quality images that offers both technologies is your best option.
Since the TFM focuses everywhere within the region of interest (the user-defined “TFM zone”), your ability to detect defects within that zone is enhanced compared with standard phased array. That said, the FMC/TFM inspection functions at a slower scan rate than phased array, and its focusing power only works in the near field. Phased array also produces excellent images, which are often similar in quality to what TFM can provide. A detailed point-by-point pros and cons discussion can be found on our FAQs about TFM page.
The OmniScan X3 flaw detector’s FMC/TFM acquisition and processing has been designed with several innovative features that further enhance the images it provides.
Here are the three most notable imaging enhancements:
1. Live TFM Envelope
The OmniScan X3 flaw detector’s advanced TFM processing includes a feature that removes the signal oscillations in the image, improving the robustness of maximum amplitude measurements and heightening the accuracy with which indications are represented. Flaw characterization and amplitude-based sizing capabilities are enhanced. The TFM envelope feature also enables a faster acquisition rate than standard, oscillating TFM rendering, while maintaining the amplitude fidelity (AF).
Acquire High-Quality TFM Images at a Faster Rate
See it with your own eyes below—this comparison shows high-temperature hydrogen attack (HTHA) flaws with the envelope on (top) and off (bottom).
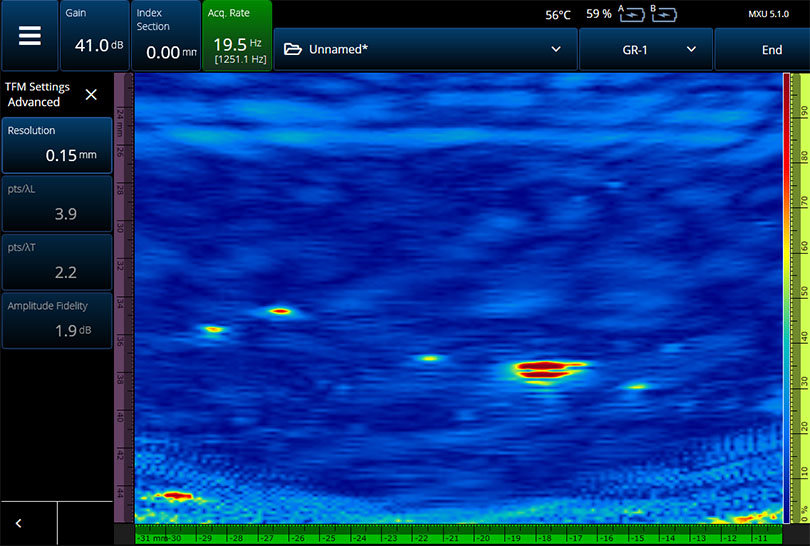
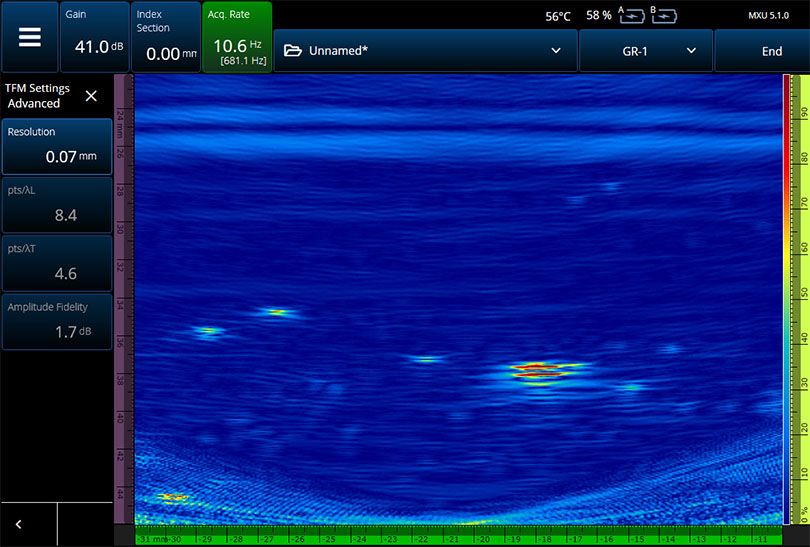
The image clearly showing the HTHA flaws (envelope on) was acquired with a coarser resolution than the TFM image with the envelope off, yet the AF reading remains under the standard 2 dB tolerance. The faster acquisition rate (19.5 Hz as opposed to 10.6 Hz) is due to the coarser resolution setting lightening the computation load. But, as you can see, the image quality does not suffer. In fact, the echoes are easier to distinguish in the TFM envelope image.
2. AIM (Acoustic Influence Map) Simulator
With a typical TFM system, you assume that the region of interest (ROI) is completely covered by the probe’s acoustic waves. But all variables affecting the acoustics, including the probe elements’ diffraction pattern, length of acoustic path, transmission and reflection coefficients at the interfaces, and characteristics of the target flaw, can impact the acoustic influence levels within the ROI.
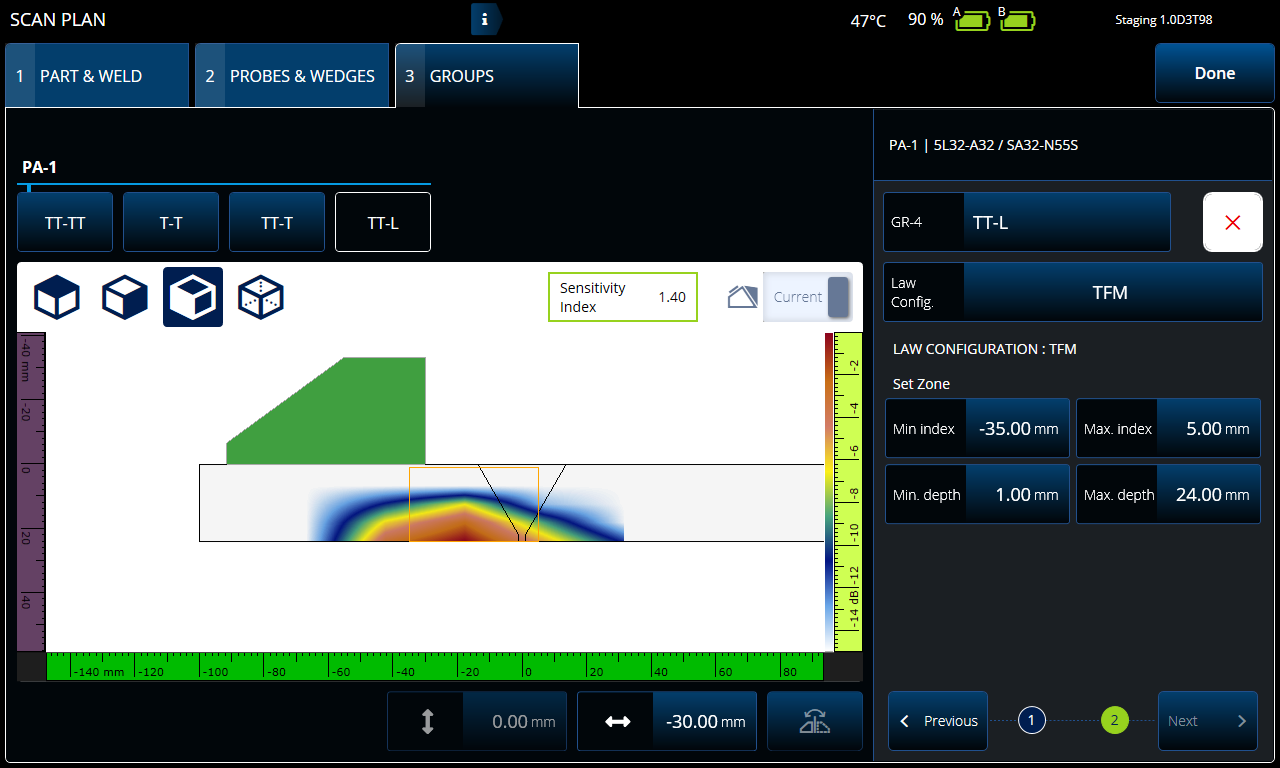
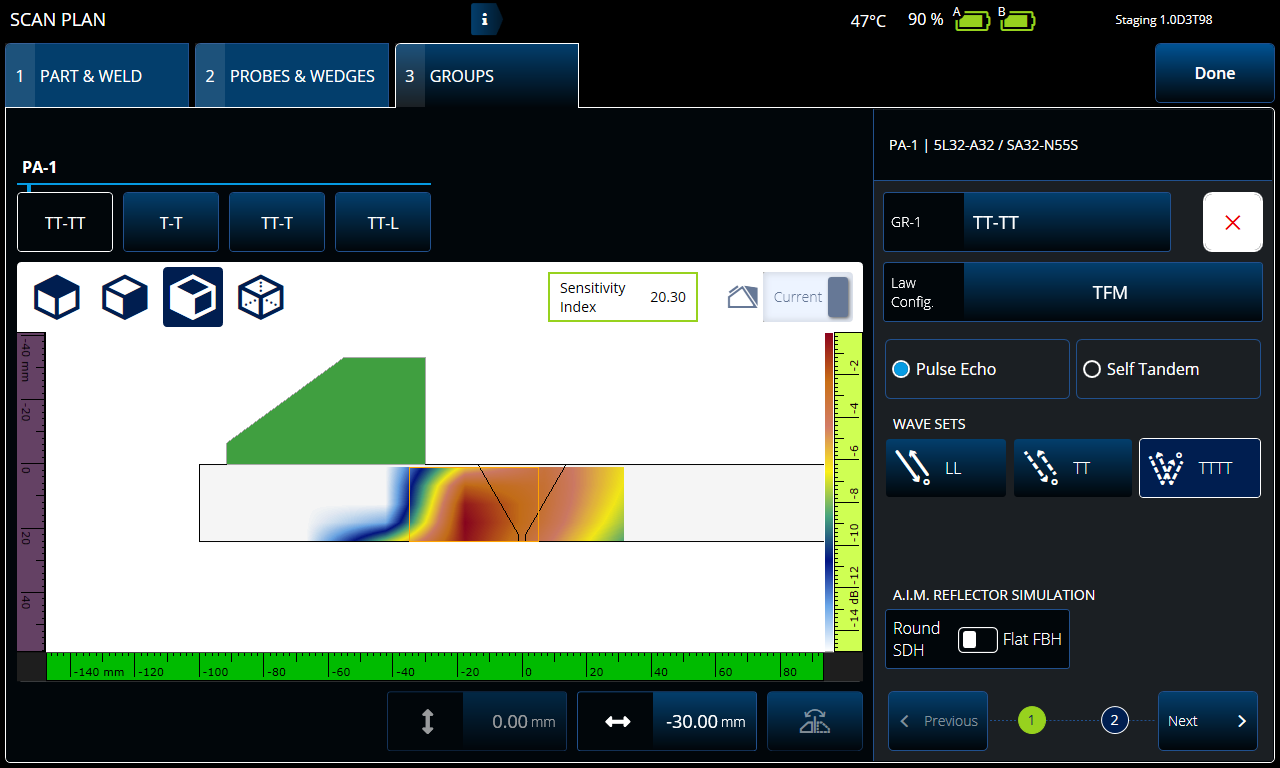
To help ensure the flaws you’re targeting are detected with a good signal-to-noise ratio (SNR), the OmniScan X3 flaw detector is equipped with a feature called the Acoustic Influence Map, or AIM.
When you’re creating your TFM scan plan onboard the flaw detector, the AIM modeling tool shows you the effective acoustic influence in the ROI of each propagation mode (or wave set). In the screen shots below, you can see the coverage provided by the TTL (top) and TTTT (bottom) TFM wave sets.
Clear Color Map Showing Amplitude Coverage
The colors of the AIM amplitude map give you a clear indication of the coverage the TFM wave sets will provide in the ROI zone.
- Red areas mean that the ultrasonic response is very good and varies between 0 dB and −3 dB with respect to the maximal amplitude
- Orange areas vary between 3 dB and −6dB from the maximal amplitude
- Yellow areas between −6dB and −9 dB
- And so on…
This tool helps you pick the right TFM wave sets to use for your inspection.
3. On-Screen Comparison of Up to 4 Wave Sets
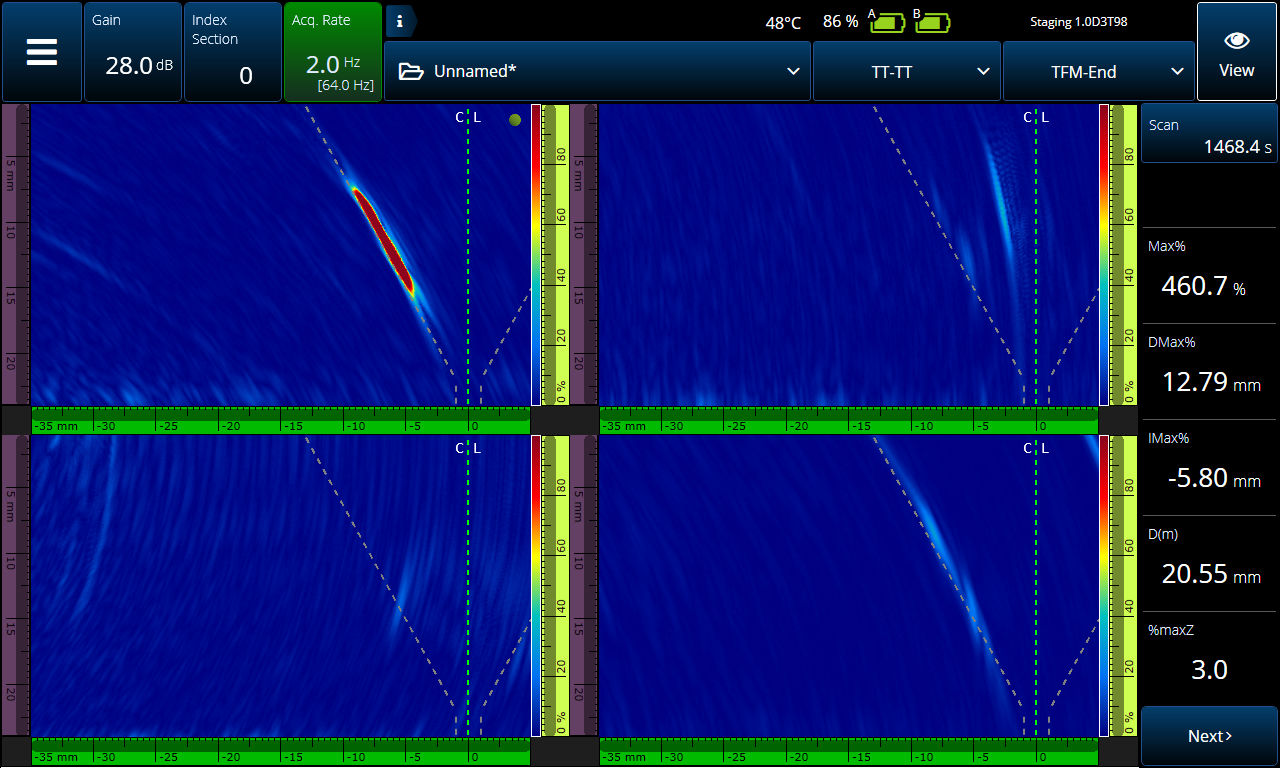
During an inspection, you can compare up to 4 wave set images on the flaw detector. Comparing these wave sets offers complementary information that can ease detection tasks such as flaw sizing.
More Precise Cursor Placement Means More Accurate Flaw Sizing
With one wave set, you may see the tip diffraction more clearly, and another may offer a better view of the corner trap, then a third (typically the TTT wave set in the case of welds) gives you the profile of the flaw in a nearly geometrically accurate position.
You can use this combination of wave set views to place your sizing cursors with more confidence.
Confidence You Can See
The combination of these TFM features makes the OmniScan X3 flaw detector a powerful tool, particularly when combined with its advanced phased array capabilities. The main advantage is that you have more diverse and informative data to help you confirm your analysis and make your calls with more certainty.
To learn more about advantages that are offered by the FMC/TFM and phased array techniques for different inspection applications, check out the links below.
Related Content
5 Reasons to Make the Switch to the OmniScan X3 Flaw Detector
Frequently Asked Questions (FAQs) about TFM
Application Note: Using the Total Focusing Method to Improve Phased Array Ultrasonic Imaging
Get In Touch
