概述
Various Measurement Instruments Are Capable of Measuring Surface Roughness
Surface roughness measurement instruments can be categorized into contact-based and noncontact-based instruments.
|
| Method | Measurement instrument | Advantages | Limitations |
| Contact-based measurement | Stylus roughness instrument |
|
|
| Non contact-based measurement | Coherence scanning Interferometers |
|
|
| Laser microscope |
|
| |
| Digital microscope |
|
| |
| Scanning probe microscope (SPM) |
|
|
Solutions of the OLS5000 Microscope for Surface Roughness |
Advantages over a contact stylus
Advantages over
coherence scanning interferometersAdvantages over
scanning probe microscopes (SPMs)
Can you correlate data from a stylus-type surface roughness measuring machine and a laser microscope? Although laser microscopes are appreciated for their ability to quickly acquire data in a noncontact manner, there is a concern that the results may not correlate with data acquired using a traditional stylus-type tool. Although some differences are inevitable with when using different measurement principles, a high degree of correlation can be achieved by unifying the measurement and analysis conditions as much as possible. The following is a comparison of data from a laser microscope and a stylus-type surface roughness measuring machine. Figure 1 shows the raw data acquired with the laser microscope before applying the filter, and Figure 3 is the data from the stylus-type measuring machine. In the case of the stylus-type tool, a λs filter (λs=2.5 µm, in this case) is usually applied to the acquired data in advance, so the same λs filter is applied to the raw data of the laser microscope (Figure 1) for comparison. Applying a filter of λs = 2.5 µm to Figure 1 results in the data in Figure 2. By comparing Figure 2 and Figure 3, we can see that they match. Thus, we can deduce that by matching the measurement conditions and applying the same filter conditions, the data from the laser microscope and the stylus instrument can be correlated. Sample: Rubert Roughness Standard No.504 Figure 1. Laser (raw data): objective 20× (NA0.6)
Figure 2. Laser (with filter): Objective 20× (NA0.6)
Figure 3. Stylus (NA0.6)
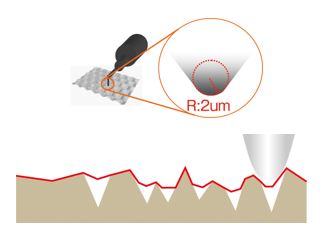
The tip radius of a stylus is 2 to 10 µm, making it difficult to capture minute changes in roughness. And because of its size, it can be difficult for a stylus to make measurements on small areas, such as wires.
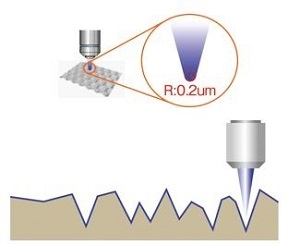
The laser used by the OLS5000 microscope, however, has only a 0.2 µm diameter, enabling it to measure fine irregularities and acquire data from small, targeted areas.
|
Another disadvantage of a stylus is that it requires direct contact between the probe and sample surface. For soft or delicate samples, the stylus can actually cause damage.
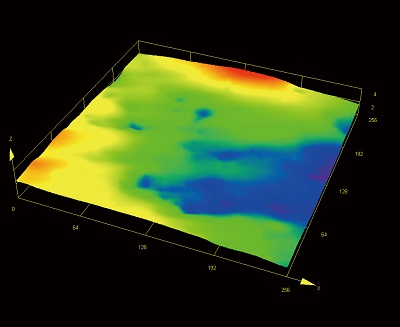
Stylus probes may damage the sample surface Because the laser used by the OLS5000 microscope acquires information without touching the sample, you can acquire accurate roughness measurements without causing damage.
Adhesive tape 256 × 256 μm |
Although whiteness interferometers offer subnanometer-level detection sensitivity for smooth surfaces, they have several disadvantages. First, they have difficulty requiring accurate measurements of steeply inclined (rough) surfaces, making them unsuitable for many applications. Their sensors also tend to pass over weak signals, further complicating the interferometers’ ability to take accurate measurements. And while they do have an objective lens, the numerical aperture is smaller than that used on optical microscopes and has a lower horizontal resolution, making it difficult to obtain clear, live images of your sample.
|
The OLS5000 microscope, on the other hand, uses a laser to make measurements and has dedicated objectives with a high numerical aperture. These features enable you to obtain accurate measurements regardless of the sample’s surface, even if it’s very steep. The high-quality objectives also enable you to view your sample while capturing measurements and obtain image data while making your measurements.
|
Scanning probe microscopes are capable of subnanometer-level measurements, but their cantilever-based scanning system makes acquiring data a time-consuming process. Their scan area is also confined to about 100 µm, making them unsuitable to measuring large features and low magnification observation.
|
OLS5000 laser microscopes accomplish sub-nanometer-level measurements much more quickly. They also enable you to observe submicron irregularities using a broad field of view. The stitching function can be used to further expand the area of analysis.
|
International StandardizationThe International Organization for Standardization (ISO) is promoting the designation of standards for areal measurement, and many basic standards are have already been adopted. The following table lists primary standards applicable to the profile and the areal method. The profile method standards were created assuming the exclusive use of contact probe-based measurement instruments. The standards designated unified measurement condition requirements, including evaluation length, cut off, the radius of the probe tip, etc. In the case of the areal method, various measurement instruments based on different operating principles are used, making it impossible to introduce unified measurement condition requirements. Accordingly, users are required to determine the suitable measurement conditions that correspond to the purpose of the evaluation. Hints for determining the measurement conditions are described in “Essentials of Surface Roughness Evaluation Using Laser Microscopy.” Primary standards of the profile and areal methods |
| Profile method type | Areal method type | |
| Surface texture parameters | ISO 4287:1997 | ISO 25178-2:2012 |
| ISO 13565:1996 | ||
| ISO 12085:1996 | ||
| Measurement conditions | ISO 4288:1996 | ISO 25178-3:2012 |
| ISO 3274:1996 | ||
| Filter | ISO 11562:1996 | ISO 16610 series |
| Categorization of measurement Instruments | - | ISO25178-6:2010 |
| Calibration of measurement Instruments | ISO 12179:2000 | Under preparation |
| Standard test pieces for calibration | ISO 5436-1:2000 | ISO25178-70:2013 |
| Graphic method | ISO 1302:2002 | ISO25178-1:2016 |
Technical Terminology and Descriptions |
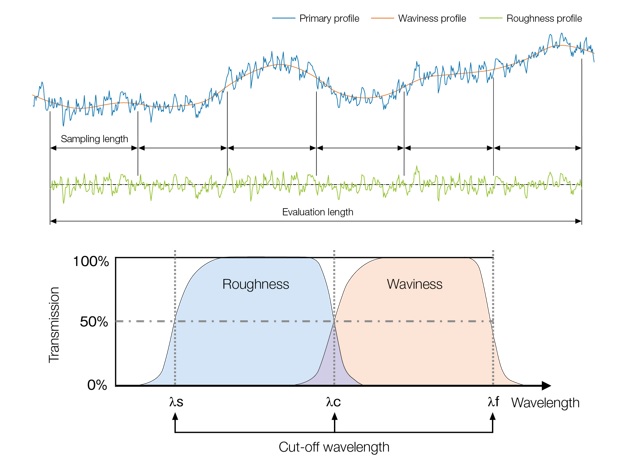
Primary profile curveThe curve obtained by applying a low-pass filter with a cutoff value of λs to the primary profile measured. The surface texture parameter calculated from the primary profile is referred to as the primary profile parameter (P-parameter). Roughness profileThe profile derived from the primary profile by suppressing the long wave component using the high-pass filter with a cutoff value of λc. The surface texture parameter calculated from the roughness profile is referred to as the roughness profile parameter (R-parameter). Waviness profileThe profile obtained by sequential application of profile filters with cutoff values of λf and λc to the primary profile. λf cuts off the long wave component while the short wave component is cut off with filter λc. The surface texture parameter calculated from the waviness profile is referred to as the waviness profile parameter (W-parameter). Profile filterThe filter for the isolation of the long and short wave components contained in the profile. Three types of filters are defined:
| Cut-off wavelengthThreshold wavelength for profile filters. Wavelength indicating 50% transmission factor for a given amplitude. Sampling lengthThe length in the direction of the X-axis used for the determination of profile characteristics. Evaluation lengthLength in the direction of the X-axis used for assessing the profile under evaluation.
Conceptual drawing of profile method |
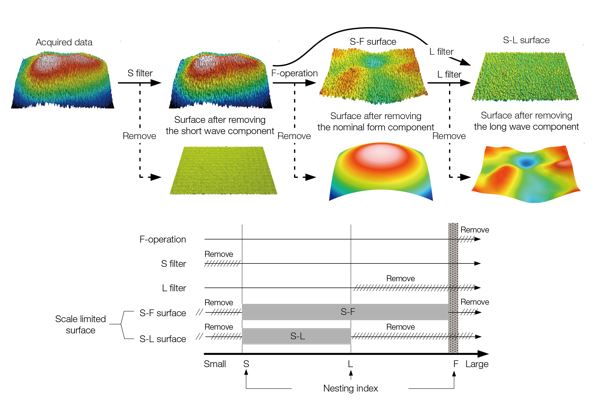
Scale limited surfaceThe surface data are serving as the basis for the calculation of areal surface texture parameters (S-F surface or S-L surface). This is sometimes referred to as 'surface.' Areal filterThe filter for the separation of the long and short wave components contained in the scale-limited surfaces. Three types of filters are defined according to function:
Note: Gaussian filters are generally applied as S and L filters, and the total least square association is applied for the F operation. Gaussian filterA type of areal filter normally used in areal measurement. Filtration is applied by convolution based on weighting functions derived from a Gaussian function. The value of the nesting index is the wavelength of a sinusoidal profile for which 50% of the amplitude is transmitted. Spline filterA type of areal filter with smaller distortion in the peripheral edge when compared to the Gaussian filter. Nesting indexThe index representing the threshold wavelength for areal filters. The nesting index for the application of areal Gaussian filters are designated in terms of units of length and equivalent to the cutoff value in the profile method. | S-F surfaceThe surface obtained by eliminating small wavelength components using the S filter and then processed by removing certain form components using the F operation. S-L surfaceThe surface obtained by eliminating small wavelength components using the S filter and then eliminating large wavelength components using L filtration. Evaluation areaA rectangular portion of the surface designated for characteristic evaluation. The evaluation area shall be a square (if not otherwise specified).
Conceptual drawing of the areal method |
Essentials of Surface Roughness Evaluation Using Laser Microscopy |
1. From the items listed below, select the appropriate objective lenses based on the item to be measured (roughness, waviness, or unevenness). Be sure that the working distance (W.D.) value exceeds the clearance between the sample and the lens.
2. If there are multiple objective lens candidates, make a final selection. The size of measurement field should be five times the scale of the coarsest structure of interest.
- If there are multiple candidates, select the objective lens with the largest possible numerical aperture (N.A.).
- If no suitable lens is available, either select again (this time including objectives labeled 'acceptable depending on usage') or consider expanding the measurement area using the stitching function.
| Objectives | Specification | Measurement item | |||||
| Numerical aperture (N.A.) | Working distance (W.D.) (unit: mm) | Focusing spot diameter* (unit: μm) | Field of measurement** (unit: μm) | Roughness | Waviness | Unevenness (Z) | |
| MPLFLN2.5X | 0.08 | 10.7 | 6.2 | 5120 × 5120 | X | X | X |
| MPLFLN5X | 0.15 | 20 | 3.3 | 2560 × 2560 | X | X | X |
| MPLFLN10XLEXT | 0.3 | 10.4 | 1,6 | 1280 × 1280 | X | ○ | △ |
| MPLAPON20XLEXT | 0.6 | 1 | 0.82 | 640 × 640 | △ | ○ | ○ |
| MPLAPON50XLEXT | 0.95 | 0.35 | 0.52 | 256 × 256 | ◎ | ○ | ◎ |
| MPLAPON100XLEXT | 0.95 | 0.35 | 0.52 | 128 × 128 | ◎ | ○ | ◎ |
| LMPLFLN20XLEXT | 0.45 | 6.5 | 1.1 | 640 × 640 | △ | ○ | ○ |
| LMPLFLN50XLEXT | 0.6 | 5 | 0.82 | 256 × 256 | △ | ○ | ○ |
| LMPLFLN100XLEXT | 0.8 | 3.4 | 0.62 | 128 × 128 | ○ | ○ | ◎ |
| SLMPLN20X | 0.25 | 25 | 2 | 640 × 640 | X | ○ | △ |
| SLMPLN50X | 0.35 | 18 | 1.4 | 256 × 256 | X | ○ | △ |
| SLMPLN100X | 0.6 | 7.6 | 0.82 | 128 × 128 | △ | ○ | ○ |
| LCPLFLN20XLCD | 0.45 | 7.4–8.3 | 1.1 | 640 × 640 | △ | ○ | ○ |
| LCPLFLN50XLCD | 0.7 | 3.0–2.2 | 0.71 | 256 × 256 | ○ | ○ | ○ |
| LCPLFLN100XLCD | 0.85 | 1.0–0.9 | 0.58 | 128 × 128 | ○ | ○ | ◎ |
* Theoretical value.
|
◎ : Most suitable
|
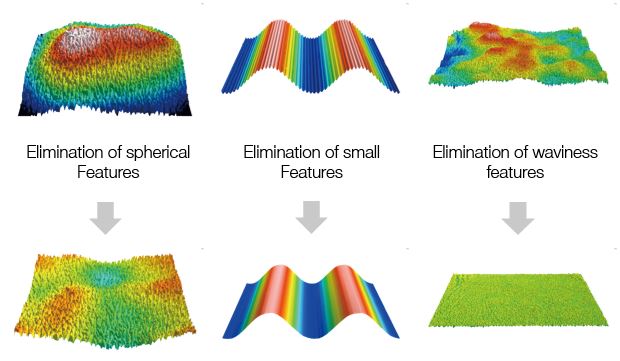
The functionality of the respective filters, the combination of filters, and the size of the filters used in surface feature analysis are as described below: The filtering conditions are determined in accordance with the objectives of the analysis. Filter functionalityIn conducting surface feature parametric analysis, the application of three types of filters (F operation, S filter, and L filter) should be considered for the surface texture data acquired in accordance with the objectives of the measurement. |
|
Filter combinations
Eight combinations are available for the three filters (F operation, S filter, and L filter). Select the combination of filters to be applied referencing the list of measurement objectives indicated in the following table.
| Intended purpose | When analyzing raw acquired data | When eliminating waviness component | When eliminating spheres, curves, and other form components | When eliminating spheres, curves, and other form components in addition to the waviness component | When eliminating small roughness components and noises | When eliminating small roughness components, noise, and waviness components | When eliminating spheres, curves, and other form components along with small roughness components and noise | When eliminating small roughness components and noise, spheres, curves and other feature components in addition to the waviness component |
| F-operation | - | - | 〇 | 〇 | - | - | 〇 | 〇 |
| S filter | - | - | - | - | 〇 | 〇 | 〇 | 〇 |
| L filter | - | 〇 | - | 〇 | - | 〇 | - | 〇 |
- : Not applicable
○ : Applicable
Filter size (nesting indices)
Filtering strength (separating capabilities) is referred to as nesting indices (L filters are alternately called cutoffs).
- The S filter eliminates increasingly more detailed feature components the larger the nesting index value is
- The L filter eliminates increasingly more waviness feature components the smaller the nesting index value is
Although the use of numerical values (0.5, 0.8, 1, 2, 2.5, 5, 8, 10, 20) are recommended when defining nesting index values, the following restrictions apply:
- The nesting index value for S filters needs to be specified to exceed the optical resolution (≒ focusing spot diameter) and at least three times the value of the data sampling interval
- The nesting index for the L filter needs to be set to a value smaller than the area of measurement (length of the narrow side of the rectangular area)


