1. Background
A vehicle’s overall quality is equal to the sum of its parts, and it is imperative for manufacturers to maintain rigid standards of excellence for every component. Manufacturers must also take into account requirements such as emission reduction, fuel efficiency, long-term durability, and regulatory standards. The increasing complexity of auto parts and components also requires manufacturers to place a strong emphasis on material characteristics, fitting tolerances, and technical cleanliness, which all play a strong role in the long-term durability, durability, and life-expectancy of the final product.
Particle contaminants can directly affect a part’s reliability, especially when the part is assembled using components from multiple suppliers. As systems and components shrink, even the smallest particles can cause catastrophic failure, making it essential to assess the technical cleanliness and integrity of components and liquids.
2. Application
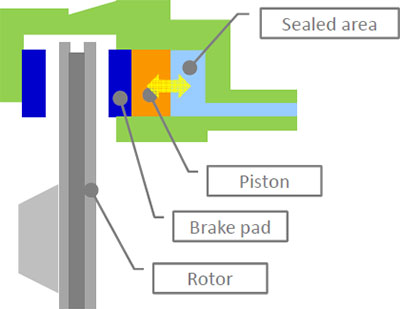
A brake caliper houses a piston that acts as a clamp to press the brake pad against the rotor (Figure 1), and the movement of the piston is essential to proper brake function. To help ensure that the piston functions properly, the area inside the brake caliper must be very clean. The piston unit is completely sealed to prevent contaminants from interfering with the action of the piston. This is especially important since a large number of contaminant particles are produced as the brake pad wears down. Cleaning is one of the most important steps in the caliper manufacturing process, and inspectors must monitor each part’s cleanliness to prevent metal chips from contaminating the caliper.

Figure 1. A diagram of a brake caliper.
One method for evaluating the cleanliness of brake calipers is to count the number of contaminant particles. In this method, contaminants are removed from the parts through liquid cleaning or ultrasonic cleaning. The cleaning liquid is then passed through a membrane filter (Figure 2). The particles trapped on the filter surface are evaluated using a microscope based system. The size and number of allowable particles are determined by company or international standards.

figure 2. The process of extracting contaminant particles for inspection.
3. The Olympus solution
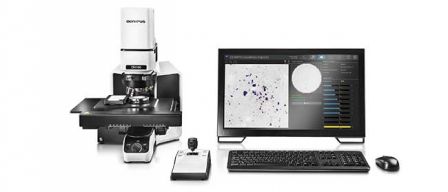
Designed to meet the cleanliness requirements of national and international directives such as ISO 16232-10 (A) (N) (V), VDA 19.1 (A) (N) (V), ISO 4406, ISO 4407, ISO 12345, NAS 1638, NF E48-651, NF E48-655 and SAE AS4059, the OLYMPUS CIX100 is a dedicated, turnkey system counting, analyzing, and classifying micron-sized contaminants and foreign particles down to 2.5 µm. The system’s all-in-one-scan solution enables scans to be completed twice as fast as other inspection systems since metallic and non-metallic particles are detected simultaneously. All counted and sorted particles are displayed live while powerful tools make it easy to revise inspection data. The system’s intuitive software guides users through each step of the process, allowing even novice operators to quickly and easily acquire cleanliness data.
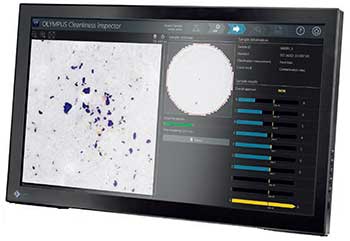
Such specifications make the Olympus CIX100 a dedicated solution for manufacturers who need to evaluate the cleanliness of brake calipers and document their cleanliness – in compliance with company and international standards. All relevant data including live and oveview images are displayed live on a single screen during the inspection (Figure 3).
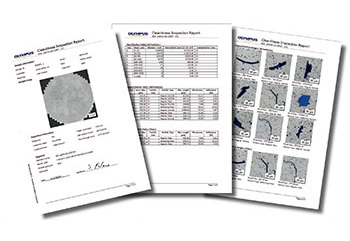
A statistical control chart function visually illustrates the level of particle class compliance for improved reliability while thumbnail images of every contaminant detected by the system are linked together with dimensional measurements for easy data review. Users can also easily retrieve the information for a particular contaminant using standard Microsoft Word templates (Figure 4). The system’s data storage capacity ensures access to reports and decisions for lont-term storage and review if necessary.
Figure 3. Image processing discriminates between contaminant types captured by the Technical Cleanliness Inspection System. |
Figure 4. A cleanliness analysis report. |


