by Russ Minkwitz
This paper provides a brief summary of advanced detection and sizing techniques for the evaluation of flaws connected to the inner surface of test material. In general, these techniques have found application for the detection, characterization and sizing of intergranular or transgranular stress corrosion cracks and fatigue-type cracks whether inherent, processing or service induced.
Overview
Once a suspected Inner-Diameter (ID) connected crack has been detected by general code or regulatory mandates, it then must be qualified. This initial process usually involves the use of the same 1.5, 2.25, or 5MHz shear wave angle beam transducer that was used in the detection phases. Further evaluation of signal amplitude, rise and fall time, echo dynamic and pulse duration, hopefully will help determine if the suspect signal is from ID geometry, counter bore, root, or if it
is an actual flaw.
Another method that can be used for the qualification process involves the use of a single element creeping wave transducer. This technique continues to grow in popularity because of simplicity and because it can provide both detection and preliminary sizing information about the suspected flaw.
More About the Single Element Creeping Wave Transducer
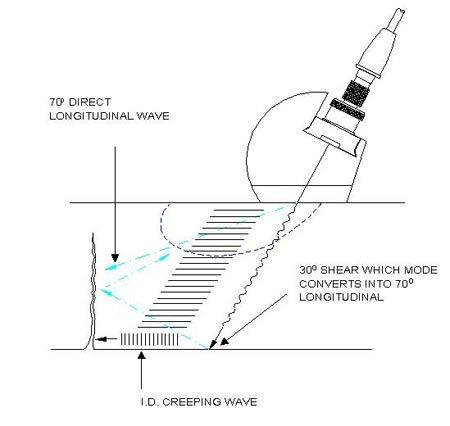
The single element transducers used in the ID creeping wave technique are designed to create a 70 deg refracted longitudinal wave in the material of interest. As a result of the incident angle used in creating this 70 deg longitudinal wave, other wave modes are created. These different modes all interact to create a unique echo pattern which will vary depending upon how far into the material the defect has propagated. The behavior of each of these components can be broken down
into the following three categories:
Direct Longitudinal Wave: This is the 70 deg refracted longitudinal wave, which after a quick and easy calibration procedure, should only appear when a crack is very deep.
Shear Wave (30-70-70): Along with the 70 deg longitudinal wave, a 30 deg shear wave is generated. The 30 deg shear wave will hit the back surface of the test piece and some of the wave energy will be reflected as a 70 deg longitudinal signal. The "mode-converted" 70 deg wave will strike the reflector face and then propagate back to the transducer. This round trip signal is also known as a "30-70-70" signal to denote the angle of each portion
of the triangular soundpath. This signal is present for mid-wall and deep cracks.
ID Creeping Wave: This wave mode is essentially a subsurface longitudinal wave which propagates along the inner surface of the test piece. The ID Creeping wave signal can be considered a "marker" as its presence provides strong evidence that an ID connected flaw may exist.
Calibration Using the Creeping Wave Transducer
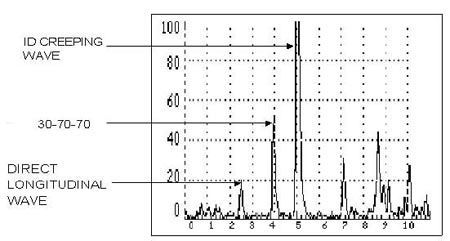
The relative ease of implementing the creeping wave technique can be attributed to the fact that calibration and signal evaluation are heavily based upon the simple concept of pattern recognition. In general, signals created by the three wave modes will either be present or absent from the A-Scan display depending upon the nature and geometry of the reflector.
Calibration involves positioning echoes from two of the three waves; the ID Creeping wave and the 30-70-70 signal. It is recommended that calibration be carried out on a calibration block that is the same thickness as the material to be examined. In order to approximate the cracks that will be inspected, a series of notches should be cut into the block. Typically, notch depth will range from 20% to 80% through wall. The side of the block can be used for the calibration as it
will produce indications from all three wave modes. The difference in the arrival times of each of the signals will be the same in the reference block and test material when they are of equal thickness. To calibrate, the 30-70-70 signal from the side of the block will be positioned at the fourth screen division of the flaw detector screen while the ID Creeping wave signal is positioned at the fifth screen division.
Once this relationship has been established, the detection and signal discrimination process, using the creeping wave transducer, may begin. Because of the relatively high level of energy contained in the creeping wave package, and the fact that it travels relatively close to the inner surface, it is extremely sensitive to ID connected cracks. However, because it is not a true surface wave and does not follow surface geometry, it will be less sensitive to reflectors such as weld
roots which provide strong indications when shear wave transducers are used. For this reason, the inspector can re-evaluate what had originally been characterized as a flaw, as well as scan the test material for additional suspected ID-connected indications.
The creeping wave transducer will also allow the user to obtain preliminary sizing information because each of the wave modes will appear only under certain conditions. The relative depth of a reflector will dictate which signals are received from the transducer.
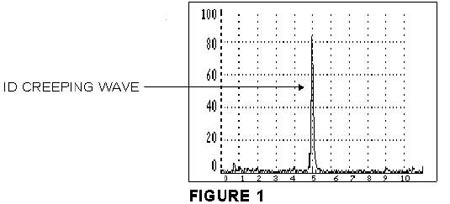
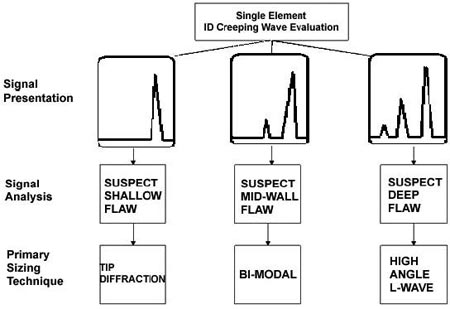
The A-scan in Figure 1 shows an ID creeping wave signal only. This would indicate the presence of a shallow defect.
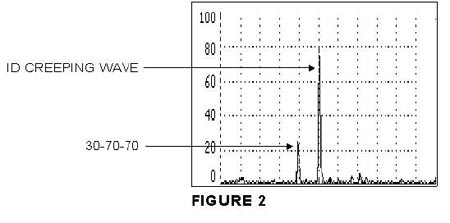
The A-scan in Figure 2 shows both an ID creeping wave signal and a 30-70-70 round trip signal. This indicates the presence of a mid-wall defect.
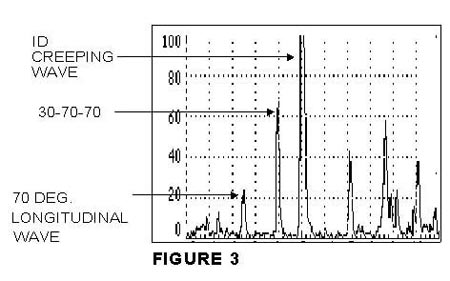
The A-scan in Figure 3 shows all three signals. The ID creeping wave, the 30-70-70 round trip signal, and the direct longitudinal wave signal are all present. This indicates the presence of a deep crack.
As with any ultrasonic technique there are limitations. The signals from the three wave modes can have different amplitude relationships depending upon transducer frequency, damping characteristics, element size, and the thickness of the material to be examined. Furthermore, the type of metal examined or actual OD surface geometries may change the incident angle thus changing the echo amplitude relationship. It is for these reasons that use of an appropriate calibration block is
recommended for this technique.
This potential variability is also the reason that this technique is referred to as a qualitative approach. The echo relationships do give a very good indication as to the approximate depth of a flaw, but further sizing techniques must be used to verify the depth of the reflector.
Sizing Techniques
Use of the Sizing Flow Chart
The results that are obtained using the ID Creeping wave technique can be summarized in a sizing flow chart. This flow chart can be used to direct the inspector to the correct technique to use during the sizing phase of inspection.
Tip Diffraction Technique
This method is used for sizing shallow cracks ranging from approximately 5-35% through wall. In this method the arrival time of the signal from the tip of the crack is used to determine crack depth. To simplify this process the instrument is calibrated so that each screen division corresponds to a particular flaw depth. Typically each of the first five screen divisions are chosen to represent 20% of the material thickness. So, a 20% through wall crack will produce a signal at
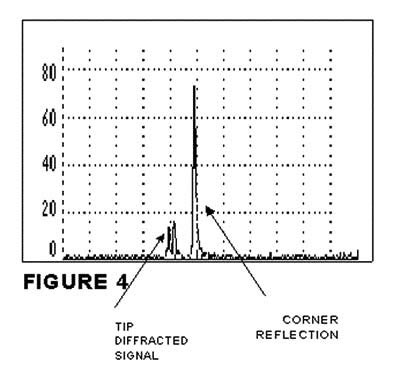
the 4th screen division, a 40% through wall crack will produce a signal at the 3rd screen division etc. Also noted during this technique is the separation of the tip signal from the corner reflection. The information obtained from this separation allows the operator to make a final and accurate determination of crack depth. An example of an A-Scan from a 20% through wall defect is shown in Figure 4.
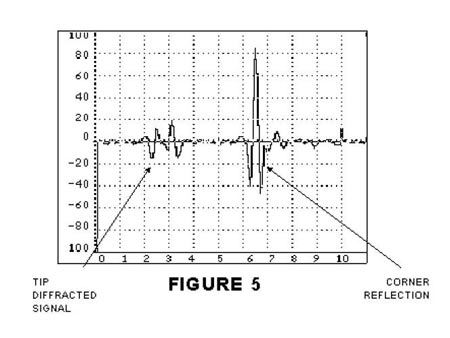
In order to provide good resolution of the signal from the crack tip, a highly-damped 5MHz, 45 or 60 deg shear wave transducer is typically used. Since the signal from the crack tip can be relatively weak, the flaw detector should have an RF display. Such a display makes it easier to see the crack tip signals when the signal-to-noise ratio is poor, as shown in Figure 5.
Bi-Modal Technique
This method is used for sizing cracks ranging in depth from 30-70% through wall. A 3MHz dual element-tandem transducer is typically used. This probe transmits a 50 deg refracted longitudinal wave and the corresponding shear wave from the front crystal and receives the wave modes from the rear crystal.
The calibration and use of this transducer is essentially a combination of the tip diffraction and creeping wave techniques. As with the tip diffraction technique, the flaw detector is calibrated so that the signal from the tip of the crack arrives at a particular screen division. As also done with this diffraction technique, the separation of the different modes are recorded and used during the evaluation/sizing process.
High-Angle Longitudinal Wave Technique
The final quantitative sizing technique is used for sizing cracks ranging in depth from approximately 60-95% through wall. This method again uses signal arrival time from the crack tip as an indication of crack depth. The signals from cracks located close to the surface are calibrated to the first few graticules while the deeper indications are calibrated to the higher numbered graticules. It should be noted that these indications show the amount of good material that is
remaining in test samples, not the actual depth of the crack. We recommend dual element high angle longitudinal wave transducers to incorporate this technique. OD creeping wave transducers are useful for detecting cracks that propagate almost completely through wall.
Conclusion
The most important aspect of these techniques is their simplicity. Once the behavior of the sound beam is understood the process of detection and sizing ID connected defects becomes one of calibration and pattern recognition. In addition, the sizing techniques are inherently more accurate because they are based on the arrival time of echoes, whereas traditional techniques that utilize signal amplitude are subject to a great deal of variability due to coupling conditions. The
effects of these variables are reduced or eliminated with time-of-flight based techniques.
|