8.1 DAC和TVG
Common Sizing Techniques
This section contains description of some common techniques used for sizing reflectors with the aid of software incorporated in contemporary digital flaw detectors. For full details on how to set up any of these functions, consult your specific instrument’s operating manual.
DAC and TVG
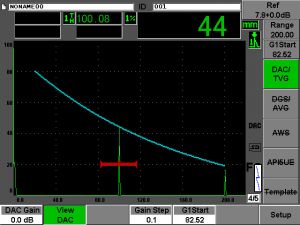
A Distance Amplitude Correction (DAC) curve is used to plot the variation in amplitude between reflectors of the same size at varying distances from the transducer. Such reflectors produce echoes whose amplitude in the far field typically decreases with distance, due to attenuation and beam spreading as the sound beam travels through the test piece. A DAC curve graphically compensates for material attenuation, nearfield effects, and beam spreading. In a DAC setup, the echo amplitude from reflectors of the same size as those used for calibration will match the curve height no matter what their depth or distance. Similarly, reflectors larger or smaller than those used for calibration will respectively produce echoes above or below the curve.
Time Varied Gain (TVG) is a related form of presentation compensating for the same acoustic factors as DAC. Instead of drawing a curve across the display that follows the reference reflector peaks downward as sound is attenuated, TVG increases gain as a function of time (sound path length) to bring all of the reference echoes to the same height, typically 80%. It is important to note that in a TVG display, instrument gain varies across the screen even though a single gain value is typically listed. Many contemporary flaw detectors allow the user to toggle between DAC and TVG displays within a single setup.
Both DAC curves and TVG are commonly set up using a series of reference reflectors representing a given reflector size at different depths. These are commercially available as Distance/Amplitude calibration block sets, or users can create their own. Some instruments also allow users to generate DAC/TVG profiles electronically, by inputting gain directly as a function of distance.
In the example above, the blue DAC curve at left represents the plotted amplitude of steel backwall reflectors at distances of 20 mm to 200 mm. The 100 mm reflector indication in midscreen matches the curve height. Switching to a TVG view, gain varies from left to right across the screen so that all backwall reflectors within the calibrated range match the height of the reference line.
It is also possible to generate multiple DAC curves. In the example above, the highest curve represents a backwall reflector and the others represent -6 dB and -14 dB respectively below the reference level (ASTM III format).


